Dashboard
ldev dashboard opens a local UI over the same operational loop that drives the CLI: understand, diagnose, fix, verify.
It is useful when you want fast visibility across many worktrees without retyping the same status and maintenance commands over and over.
Start it
ldev dashboard
ldev dashboard --port 4242 --no-open
By default it opens a browser automatically. Use --no-open when you want to keep the process attached to the terminal and open the URL yourself.
What it shows
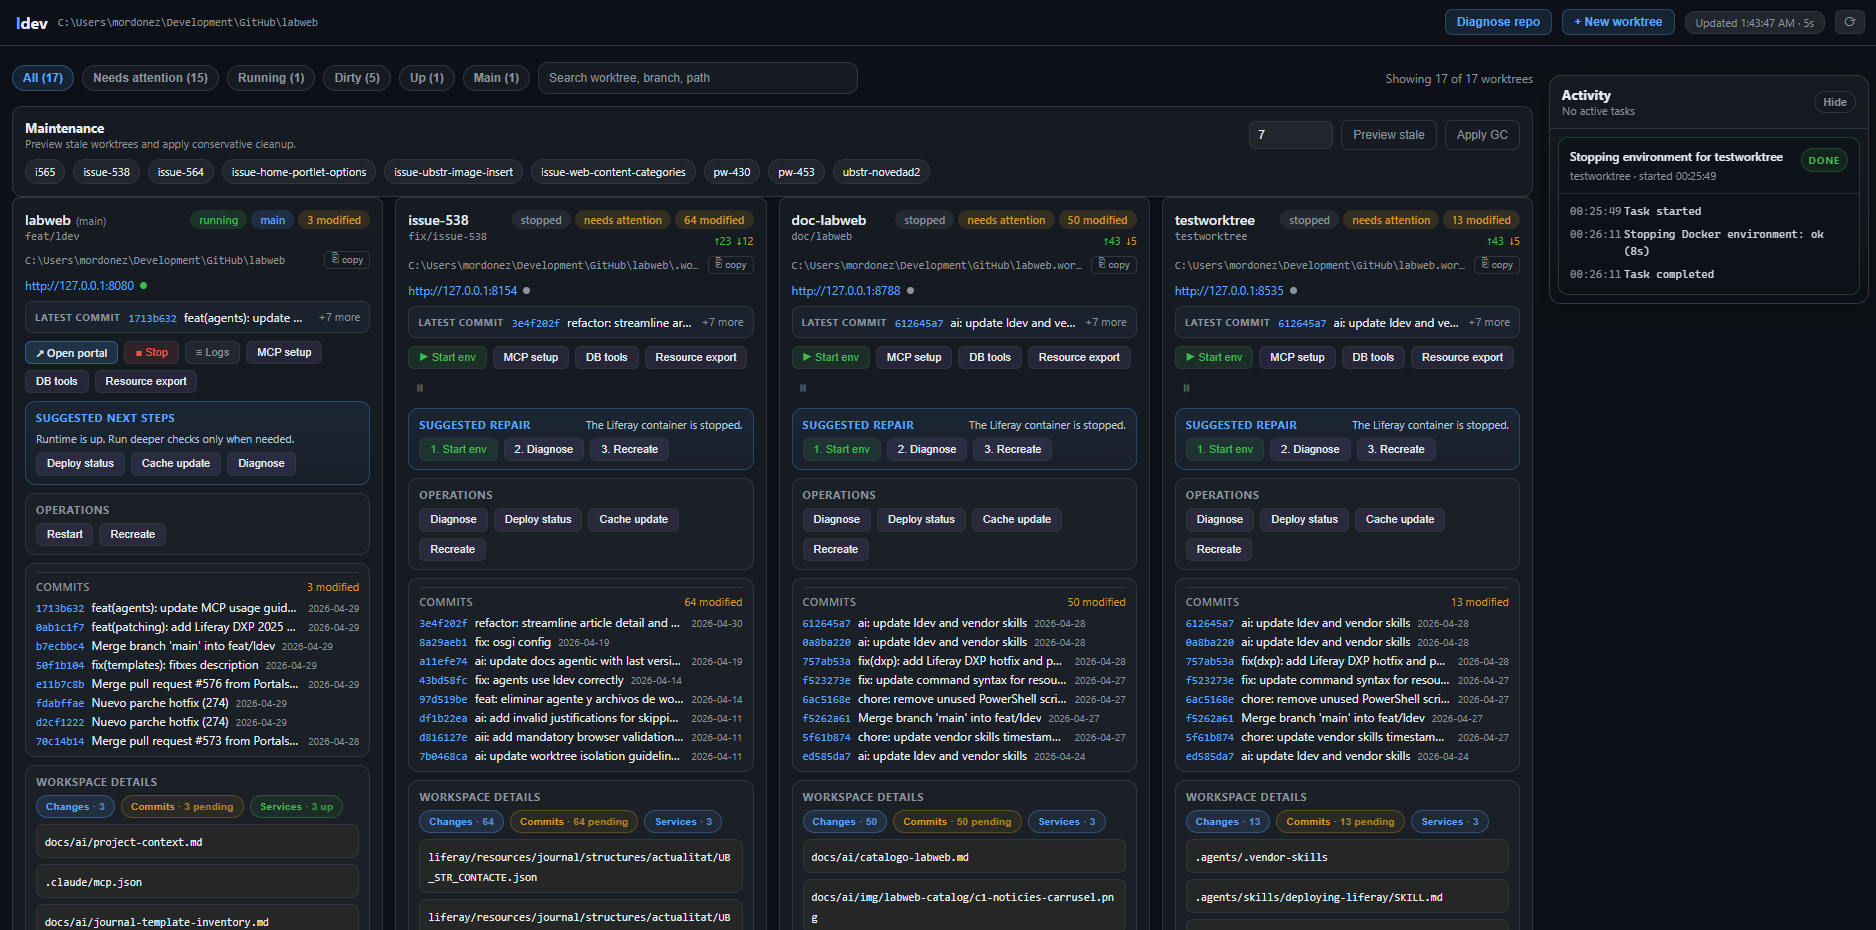
- worktree inventory, branch, ahead/behind, and main checkout context
- recent commits and local changed files per worktree
- local environment state, portal URL, and service health when an isolated env exists
- a live activity rail for long-running actions started from the dashboard
- maintenance preview for stale worktrees
What you can do from it
- create a new worktree and optionally prepare its isolated local env
- start, stop, restart, or recreate worktree environments
- inspect logs, diagnose a repo or worktree, and check deploy status
- run guided DB actions for a worktree environment
- export templates, structures, ADTs, and fragments for a selected worktree environment
Git visibility
The dashboard intentionally keeps git visibility lightweight:
- recent commits stay visible on each card
- dirty worktrees surface changed-file counts immediately
- the
Changessection lists the current modified paths directly on the card
This is enough for triage and worktree selection. Full diff browsing is a separate concern and should stay a follow-up unless the dashboard grows a dedicated git view with its own seam.
When to use the dashboard vs CLI
Use the dashboard when you need a fast local control surface across multiple worktrees.
Use the CLI when you need:
- structured output for automation
- exact command history in a ticket or incident log
- scripts or agent workflows that must remain reproducible
The CLI remains the canonical interface. The dashboard is a local operational console built on top of it.